Meet the TheyDo Agent
Show where CX moves the business
Measure, report, and prove the business impact of every change in the customer experience.


Most CX work doesn't have a real number behind it
CX teams steward improvements all year. They redesign experiences, brief product teams, run journey programs. But when the budget review comes, the work shows up as activities, not as the line items the business actually tracks.
Connect every journey change to the business outcome it moved
TheyDo connects three things most CX programs run separately.
The journey change
The work CX delivered - a redesigned step, a new flow, a cleaned-up handoff.

Where CX shows business impact
Connect work to KPIs
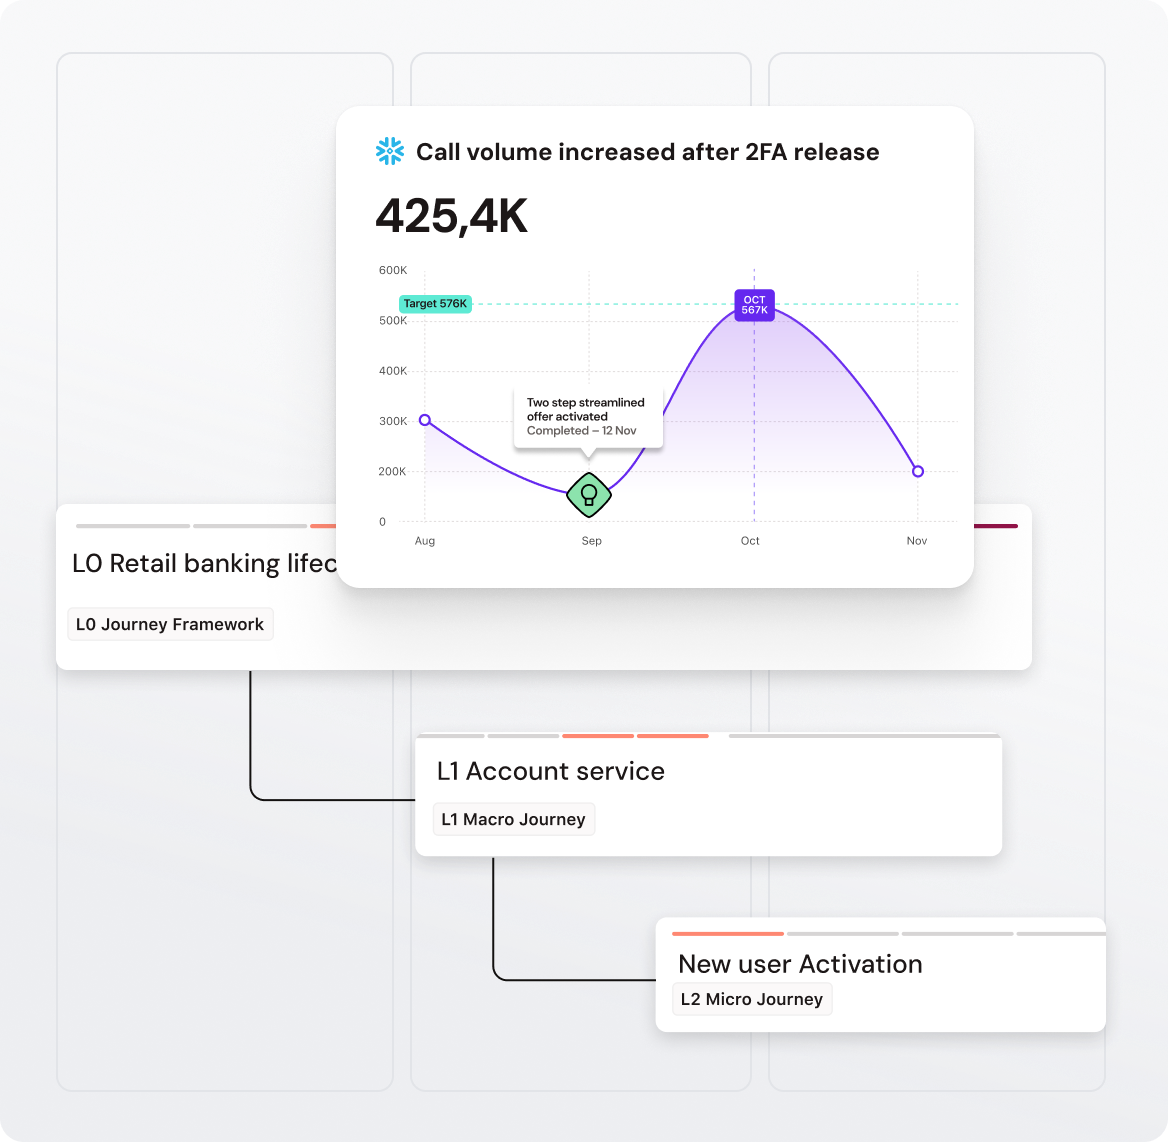
Link the KPIs your business already reports on (NPS, CSAT, retention, cost-to-serve, revenue) directly to the journey step where the work landed. Set a goal, then watch the metric move toward it on the same canvas you design the work on.
Share with execs
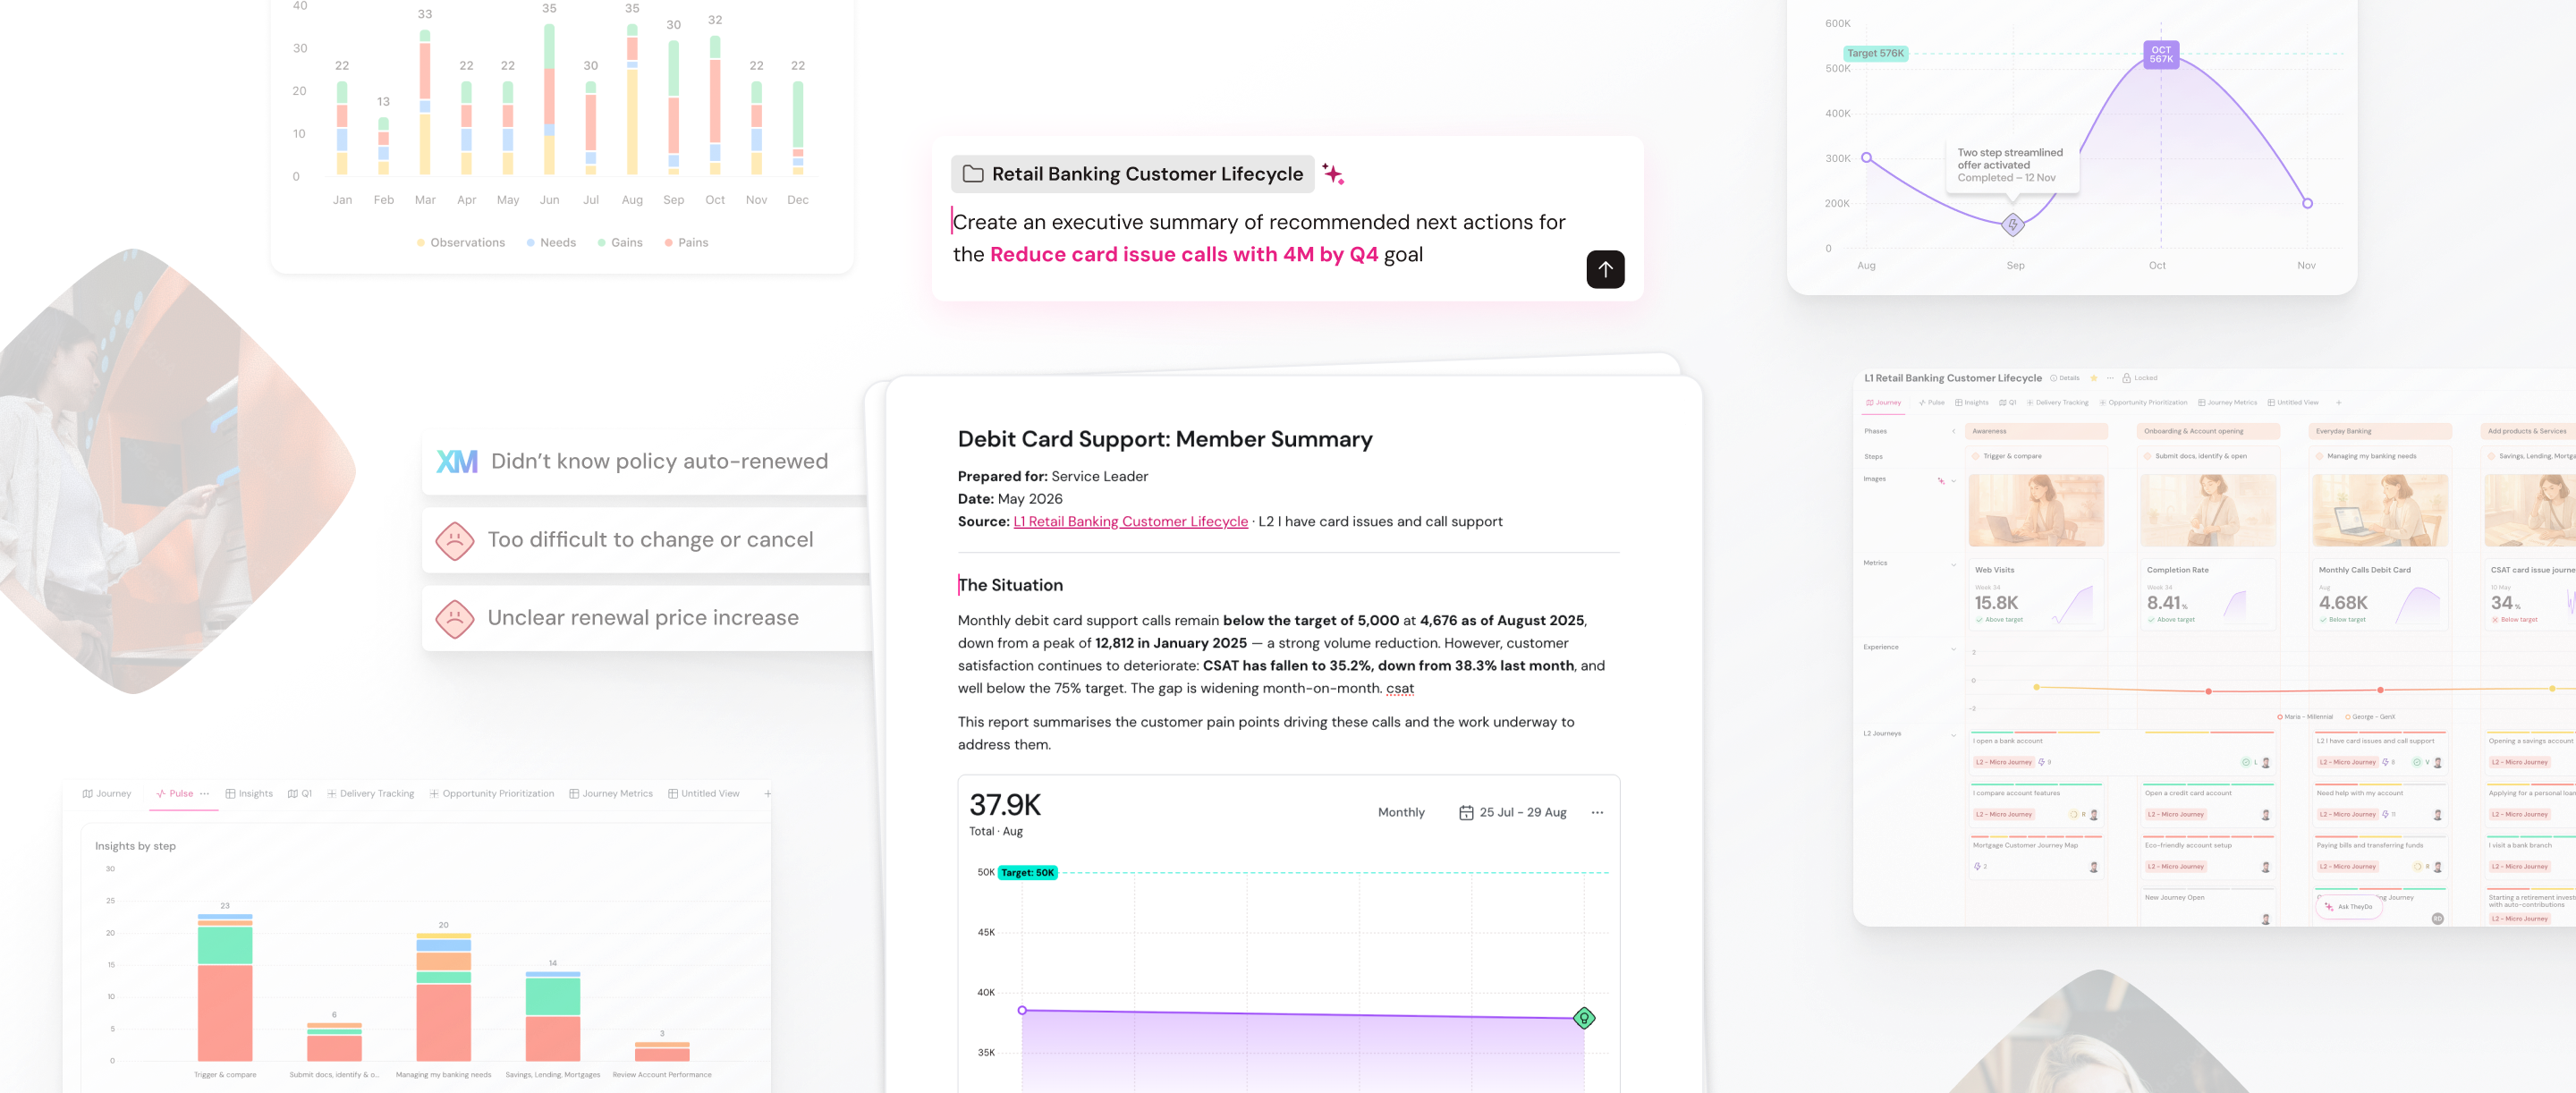
TheyDo Agent generates stakeholder-ready briefs for any audience: a board narrative, an exec summary, a finance review. Every claim cites the journey step, insight, or metric it came from, and exports to PDF for stakeholders who don't have a TheyDo seat.
Hit a measurable goal
Set a workspace goal, like cutting cost-to-serve by 20% or moving NPS from 38 to 50, and watch the metric trend toward it on the same canvas as the work.
CX teams already delivering intelligence this way
Loading testimonials...
Ready to show business impact?
4,000+
hours saved
36%
efficiency lift
5x
time to value
90%
shorter time-to-decision
Questions buyers actually ask
How do you measure the business impact of customer experience?
TheyDo attaches metrics like NPS, retention, cost-to-serve, and revenue directly to the journey steps where the work lands. When a journey change ships, the metric moves on the same canvas, and the dollar value sits right there with it. No need to switch between three systems to make the case.
How do I build a CX ROI case in TheyDo?
Three steps.
Measure - link your journeys to the KPIs the business already tracks.
Reports - auto-generate the CX Impact Report scoped to your audience.
Goals - set the target and watch progress against it as work ships. Most CX leaders run the first two before the meeting and bring TheyDo Agent into the room.
How is TheyDo different from a BI dashboard?
A BI dashboard shows what's happening. TheyDo shows why: the specific journey change that drove the metric movement, and the financial impact behind it. The dashboard tells you the number; TheyDo tells you what produced it.
Can a CX impact report stand up to CFO scrutiny?
Yes. Every claim cites its source: the journey step, the insight, the metric. NCR Voyix proved 11x ROI. A leading bank saved €1.3M annually on cost-to-serve. Lufthansa avoided millions in wasted R&D. The case holds up because the evidence is one click away from every claim.
What metrics can TheyDo track?
Whatever your business reports on. CX teams typically attach NPS, CSAT, and CES on the experience side; cost-to-serve, call minutes, and FCR on the operational side; conversion, retention, and ARR on the commercial side. Each metric sits on the journey steps where the work happens.